Address
Mataram, Nusa Tenggara Barat, Indonesia
Work Hours
Monday to Thursday : 9AM - 5PM
Fryday: 9AM - 4PM
Address
Mataram, Nusa Tenggara Barat, Indonesia
Work Hours
Monday to Thursday : 9AM - 5PM
Fryday: 9AM - 4PM

1. Introductions
North Lombok Regency (KLU) presents significant development challenges, particularly in terms of economic well-being. According to 2024 Statistics Indonesia (BPS) data, KLU has the highest percentage of poor residents in West Nusa Tenggara (NTB) Province.
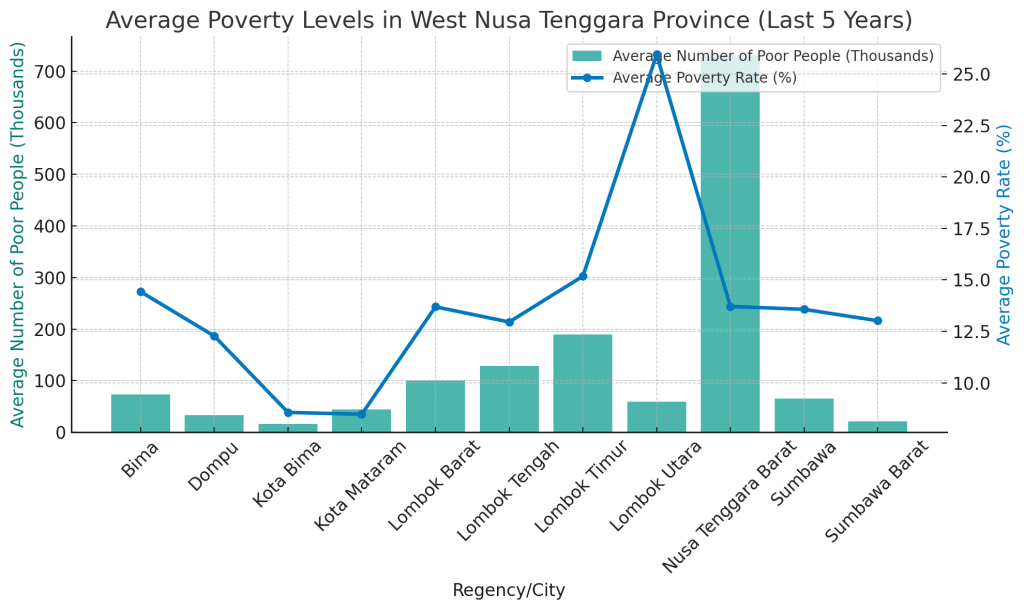
Figure 1. Average Poverty Levels in West Nusa Tenggara Province (Last 5 Years)
The poverty rate in KLU (North Lombok) reached 23.96%, nearly double the average for West Nusa Tenggara (NTB) province of 12.91%. This drastic disparity indicates a deep structural problem, where the benefits of development have not been distributed equitably.
The majority of KLU’s population relies on the agriculture, forestry, and fisheries sectors for their livelihoods. However, these sectors are still managed traditionally, are highly dependent on the seasons, and have relatively low productivity. Limited access to technology, capital, and markets makes it difficult for farmers to break out of the cycle of poverty. Furthermore, farmer regeneration is hampered because the younger generation views the sector as unpromising.
Therefore, the Sino International Research and Development Foundation initiated a strategic intervention program through “Sensor Technology-Based Smart Farming Training” as part of our “Coaching” and “Workshop” programs. This program is designed to introduce precision agriculture technologies that can increase efficiency, productivity, and sustainability, while also attracting the interest of the younger generation to re-establish the agricultural sector.
| Figure 2. Agricultural Sector in North Lombok Regency |
2. Program Justification: Needs Analysis
The initiation of this program is based on an in-depth analysis of the socio-economic conditions of North Lombok Regency (KLU). 2024 BPS data highlights significant welfare challenges, with KLU recording the highest percentage of poor people in West Nusa Tenggara (NTB) (23.96%), with a primary concentration in agricultural areas.
However, behind these challenges lies extraordinary economic potential. To validate this potential, we used Location Quotient (LQ) analysis. The LQ is a vital economic analysis tool for measuring the level of specialization or concentration of a sector in a region (in this case, KLU) compared to the wider region (NTB Province).
The LQ interpretations:
Our Location Quotient (LQ) analysis confirms that the Agriculture, Forestry, and Fisheries sector is the heart of the KLU economy. Contributing 35.16% to KLU’s total GRDP—far exceeding the average contribution of West Nusa Tenggara province of 21.45%—this sector yields an LQ of 1.64.
This result, significantly greater than 1, quantitatively demonstrates that KLU agriculture is a leading base sector, boasting export capacity and serving as a key driver of regional growth.
To provide broader context, here is a comparison of the LQ values of the agriculture sector with several other key sectors in KLU, based on KLU GRDP data (2022/2023) and comparable data on NTB GRDP (2024), as well as related analysis results:
Table 1. Analysis Location Quotient (LQ)
| Sector Category | Business Field Sector | LQ Value (KLU vs NTB) | Description |
| Accommodation & Food Services (Tourism) | ~ 2.60 | Main Leading Sector (LQ > 1) | Base Sector (Priority Sector) |
| Agriculture, Forestry, and Fisheries | 1.64 | Leading Sector (LQ > 1) | Base Sector |
| Wholesale & Retail Trade | ~ 0.94 | Non-Base Sector (LQ < 1) | Local Sector |
| Transportation & Warehousing | ~ 0.83 | Non-Base Sector (LQ < 1) | Local Sector |
| Manufacturing Industry | ~ 0.16 | Non-Base Sector (LQ < 1) | Local Sector |
Note: The LQ values above are calculated from various BPS data sources (2022-2024)
Table Discussion: The table above reveals a crucial fact: KLU has two main economic engines: the Tourism Sector (LQ ~2.60) and the Agriculture Sector (LQ 1.64). Other sectors, such as Trade, Transportation, and Industry, remain non-basic, primarily serving local needs.
This analysis strengthens the program’s justification. The high poverty rate (23.96%) in a region with two leading sectors also indicates a disconnect. The very strong tourism sector has not been able to optimally trickle-down welfare to the largest population base, namely farmers.
The Smart Farming program is designed to bridge this gap. By modernizing the agricultural sector, we will not only improve the welfare of farmers but also create premium agricultural products (horticulture, fruits, etc.) that can supply the needs of the Tourism Sector (hotels and restaurants). This will create a double multiplier effect, empowering farmers while strengthening the local supply chain.
However, this comparative advantage is indicated as not yet being fully optimized. Our hypothesis, which will be explored through Shift-Share analysis, is that the growth of this leading sector has not been as rapid as in other regions (suspected to have a negative Competitive Share value). This gap indicates structural issues such as lagging technology adoption and traditional farming management, which simultaneously presents significant opportunities for intervention.
Therefore, the “Sensor Technology-Based Smart Farming Training” program is designed as a progressive strategic intervention. This program aims not only to alleviate poverty but also to fundamentally transform the economic drivers of KLU. This is an affirmative step to ensure that the backbone of KLU’s economy is not only strong, but also competitive, modern, and sustainable by addressing productivity gaps through technology adoption.
3. Program Objectives
General Objective: To improve farmer welfare and reduce poverty in North Lombok through sensor-based agricultural modernization.
Specific Objectives:
4. Village Agricultural Economic Potential
The implementation of Smart Farming will unlock untapped economic potential in KLU:
5. The Role of Youth
Farmer regeneration is a crucial issue. This program positions youth as key agents of change, not simply participants:
6. Smart Farming Projection in Village Agriculture
The implementation of the Smart Farming program is projected to have a measurable, transformative impact on the agricultural ecosystem in North Lombok. To ensure sustainability and scalability, we have designed a roadmap divided into three main phases: short-term, medium-term, and long-term. Each phase has a clear focus, targets, and success indicators, which will guide the program’s evolution from a pilot project to standard practice at the district level.
Table 2. Program Projection Planning
| Time Frame | Main Focus & Activities | Key Performance Indicators (KPI) |
| Short-Term (Year 1) | Initiation & Pilot Projects: build 2–3 Smart Farming pilot plots; train core farmer groups and local youth. | 2–3 pilot projects fully operational; ≥ 20% efficiency increase in water & fertilizer use. |
| Medium-Term (Years 2–3) | Replication & Entrepreneurship: expand model beyond pilot areas; form young agritech entrepreneur groups (sensor/drone services). | ≥ 1 young farmer entrepreneur group created; technology adoption spreading to other farmer groups. |
| Long-Term (Years 4–5) | Standardization & Systemic Impact: Smart Farming becomes standard practice in KLU; build partnerships with local gov & off-takers. | Measured decrease in production costs and increase in farmer income; KLU as NTB Smart Farming model; reduction in target village poverty. |